 EINSURANCE
Motorcycle Crashes
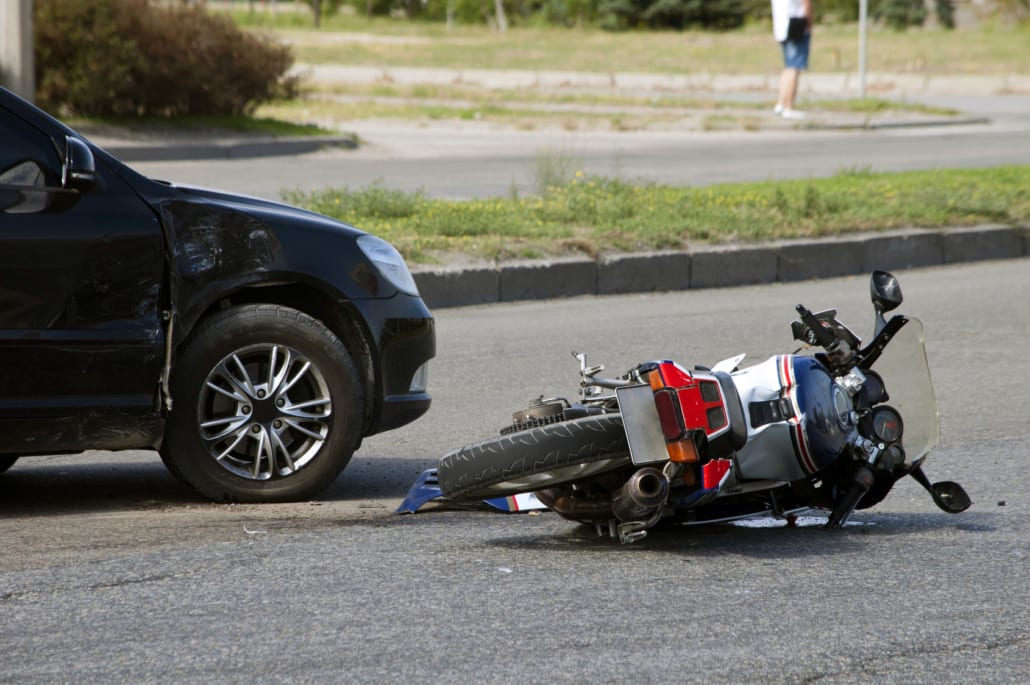
The Topic: Motorcycle Crashes
Motorcycle riding has become more popular in recent years, appealing to a new group of enthusiasts consisting of older and more affluent riders. Sales of all types of two-wheeled motorcycles totaled over 1 million in 2008, but fell about 41 percent in 2009. There were 7.1 million motorcycles on the road in 2007, according to the U.S. Department of Transportation. At the same time motorcycle fatalities have also been climbing, reaching 5,290 in 2008, the highest level since the Department of Transportation began collecting data in 1975. There has also been a dramatic jump in the number of deaths among motorcyclists age 40 and older in recent years.
Motorcycles are by their nature far less crashworthy than closed vehicles. They are also less visible to other drivers and pedestrians and less stable than four-wheel vehicles. Operating a motorcycle requires a different combination of physical and mental skills than those used in driving four-wheel vehicles. Motorcyclists and their passengers are more vulnerable to the hazards of weather and road conditions than drivers in closed vehicles.
Motorcycle insurance is widely available. As motorcycles became more popular, more insurers entered the market. Now, most of the top ten auto insurers offer motorcycle insurance, either as an endorsement to a personal automobile policy or as a separate policy, in most of the states in which they operate. Many have recently expanded into new states. For more information see Motorcycle Insurance in the Specialty Insurance section of the I.I.I. Web site.
Key Facts
- Motorcycle crash fatalities fell about 10 percent in 2009 from the previous year, according to preliminary data from the Governors Highway Safety Association. The association estimates that 4,762 people died in motorcycle crashes in 2009, compared with 5,290 in 2008, a record high (see below). The decrease in 2009, based on data for the first nine months, was highest in California (down 29 percent), followed by Florida and Ohio (down 27 percent and 26 percent, respectively.) Possible factors accounting for the decline are a decrease in motorcycle use due to the weak economy, poor weather in some states, fewer novice riders and increased state attention to motorcycle safety programs.
- The National Insurance Crime Bureau said that motorcycle thefts fell 13 percent in 2009 from a year earlier, based on data from the National Crime Information Center of the Federal Bureau of Investigation. Motorcycle thefts have declined each year from 2006 to 2009 with the largest decrease occurring between 2008 and 2009. The top five makes stolen and the top five states in thefts are shown below:
Top Five Makes Stolen, 2009 Top Five States in Motorcycle Thefts, 2009
1. Honda 13,688 1. California 6,273
2. Yamaha 9,154 2. Texas 5,526
3. Suzuki 9,154 3. Florida 5,009
4. Kawasaki 5,911 4. North Carolina 3,045
5. Harley-Davidson 3,529 5. Georgia 2,067
- 2008 Crash Data: According to the U.S. Department of Transportation’s National Highway Traffic Safety Administration (NHTSA), in 2008, 5,290 people died in motorcycle crashes, the highest level since NHTSA began collecting data in 1975. The 2008 figure represents a 2.2 percent increase from 5,174 the previous year.
- Motorcycle crash fatalities have increased every year for the past 11 years.
- According to the latest data available from the Federal Highway Administration, there were 7.1 million motorcycles on U.S. roads in 2007, compared with 137.8 million passenger cars. Motorcycles accounted for nearly 3 percent of all registered motor vehicles and 0.4 percent of vehicle miles traveled in 2007, according to the NHTSA.
- Some 114,000 motorcycles were involved in crashes in 2008, including property damage-only crashes, according to latest data from the NHTSA.
- Motorcyclists were 37 times more likely than passenger car occupants to die in a crash per vehicle mile traveled in 2007 and nine times more likely to be injured, according to NHTSA.
- The fatality rate per registered vehicle for motorcyclists in 2008 was 6 times the fatality rate for passenger car occupants, according to NHTSA.
Fatalities and Injuries
Overall: According to the U.S. Department of Transportation’s National Highway Traffic Safety Administration (NHTSA, http://www.nhtsa.dot.gov), the following new terms are now being used to define motorcycle occupants: a motorcycle rider is the operator only; a passenger is any person seated on the motorcycle but not in control of the motorcycle; and any combined reference to the motorcycle rider (operator) as well as the passenger will be referred to as motorcyclists.
NHTSA says that in 2008, 5,290 motorcyclists died in crashes, up 2.2 percent from 5,174 in 2007, marking the eleventh consecutive year of higher motorcycle deaths. Motorcycle fatalities are at their highest level since NHTSA began collecting data in 1975. From 1997, a historic low, to 2008 motorcycle fatalities rose 150 percent. In 2008, 96,000 motorcyclists were injured in accidents, down 6.8 percent from 2007 but up 96 percent from 49,000 in 1998.
In 2008 motorcyclists accounted for 14 percent of all traffic fatalities, 17 percent of all occupant fatalities and 4 percent of all occupants injured.
By Age: Older motorcyclists account for half of all motorcyclist fatalities. NHTSA data show that in 2008, 51 percent of motorcyclists killed in crashes were age 40 or over, compared with 33 percent 10 years earlier. In contrast, fatalities among young motorcyclists have declined in the past 10 years, relative to other age groups. In 2008 fatalities in the under 30-year-old group dropped to 31 percent of total motorcyclists killed in crashes from 40 percent in 1998. Fatalities among motorcyclists in the 30-to 39-year-old group fell to 19 percent in 2008 from 27 percent ten years earlier.
By Driver Behavior: Alcohol use: NHTSA says that in 2008, 29 percent of motorcycle riders involved in fatal crashes had a blood alcohol concentration (BAC) over 0.08 percent (the national definition of drunk driving), compared with 23 percent of drivers of passenger cars, 23 percent of light truck drivers and 2 percent of large truck drivers in fatal crashes.
Of all fatally injured motorcycle riders, 30 percent had BACs of 0.08 percent or higher in 2008. Another 7 percent had lower alcohol levels (0.01 to 0.07 percent BAC.). Fatally injured motorcycle riders between the ages of 40 to 49 had the highest percentage of BACs 0.08 percent and above (41 percent), compared with 36 percent for those ages 35 to 39. Forty-three percent of the 2,291 fatally injured motorcycle riders who died in single-vehicle crashes in 2008 (for example, those in which the motorcycle crashed into a stationary object) had BACs of 0.08 percent or higher. On weekend nights, the proportion was higher: 64 percent of motorcycle riders who died in single-vehicle crashes had BACs of 0.08 percent or higher.
Motorcycle riders killed in traffic crashes at night were nearly 4 times more likely to have BAC levels at or over 0.08 percent (48 percent) than those killed during the day (13 percent).
The reported helmet use rate for motorcycle riders with BACs at or over 0.08 percent who were killed in traffic crashes was 46 percent, compared with 66 percent for those who did not have any measurable blood alcohol.
Speeding: In 2008, 35 percent of all motorcycle riders involved in fatal crashes were speeding, compared with 23 percent for drivers of passenger cars, 19 percent for light truck drivers and 8 percent for large truck drivers, according to NHTSA.
Licensing: One out of four motorcycle riders (25 percent) who were involved in fatal crashes were riding without a valid license in 2008, compared with 12 percent of passenger vehicle drivers. NHTSA says that motorcycle operators were also 1.4 times more likely than passenger vehicle drivers to have a prior license suspension or revocation (18 percent compared with 13 percent).
By Type of Motorcycle: According to the Insurance Institute for Highway Safety (IIHS), riders of “supersports” motorcycles have driver death rates per 10,000 registered vehicles nearly four times higher than for drivers of other types of motorcycles. Supersports have more horsepower than conventional motorcycles and can reach speeds of up to 190 mph. They are built on racing platforms and are modified for street use. The bikes are popular with riders under the age of 30. The bikes are light-weight and aerodynamically styled. In 2005, these bikes registered 22.5 driver deaths per 10,000 registered vehicles compared with 10.7 deaths for other sport models (related to supersports but do not have the acceleration, stability and handling of supersports). Standards and cruisers and touring bikes, with upright handlebars, have rates of 5.7 and 6.5 per 10,000 vehicles. In 2005, supersports accounted for 9 percent of registrations, and standards and cruisers made up 51 percent of registrations. Among fatally injured drivers, the IIHS says that drivers of supersports were the youngest—with an average age of 27. Touring motorcycle drivers were the oldest, 51 years old. Fatally injured drivers of other sports models were 34, on average; standard and cruiser drivers were 44 years old. Speeding and driver error were bigger factors in supersport and sport fatal crashes. Speed was cited in 57 percent of supersport riders’ fatal crashes in 2005 and in 46 percent for sport model riders. Speed was a factor in 27 of fatal crashes of riders of cruisers and standards, and for 22 percent of riders of touring models.
Insurance Losses
Collision Losses by Type: The IIHS says that supersports have the overall highest insurance losses under collision coverage among the motorcycle classes, almost four times higher than for touring models and more than six times higher than for cruisers. Nine of the ten motorcycles with the highest losses were supersports. Claim frequency is driving the high losses for supersports, meaning that they are involved in more collisions than other types of motorcycles—there were 9 claims per 100 insured vehicle years for supersports models, compared with 2.3 for all models. The models surveyed were all 2002-2006 models. Touring motorcycles had the most expensive claims because they are the most expensive to purchase. Supersport models are the most popular with thieves—with average loss payments for theft losses per insured vehicle years of $246 for 2002-2006 models, seven times higher than the average for all motorcycles. Supersport models had the highest frequency of thefts—31.8 per insured vehicle year, compared with cruisers and touring models which had the lowest at 1.1 claims per insured vehicle year. However, touring models had the highest average loss payments—$15,696, reflecting their high purchase price and upgrades.
Safety Issues
The Motorcycle Safety Foundation (MSF, http://www.msf-usa.org), sponsored by motorcycle manufacturers and distributors, works with the National Highway Traffic Safety Administration (NHTSA), state governments and other organizations to improve motorcycle safety through education, training and licensing. Since 1973 about 3.2 million motorcyclists have taken MSF training courses. The organization also works with the states to integrate rider safety and skills in licensing tests. It also promotes safety by recommending motorcycle operators wear protective gear, especially helmets, ride sober and ride within their skill limits.
Antilock Brakes: The Insurance Institute for Highway Safety (IIHS) released two studies in late 2008 that show that antilock brakes help reduce crashes. Stopping a motorcycle is more complex than stopping a car. Motorcycles have separate brakes for the front and rear wheels, and braking hard can lock the wheels and cause the bike to overturn. Not braking hard enough can put the rider into harm’s way. One IIHS study compared collision insurance losses for 12 motorcycle models with antilock brakes, which are optional equipment, with the same models without the brakes. After accounting for other factors, the researchers found that insurance losses were 21 percent lower for bikes with antilock brakes, mainly because there were 19 percent fewer claims. However, they found that while having antilock brakes prevented some crashes, they did not decrease the cost of the crashes that did occur. In the second study, rates of fatal crashes for eight models were studied. There were 6.6 fatal crashes per 100,000 registered bikes without antilock brakes, and 4.1 for bikes with the brakes, a 38 percent difference.
Airbags: Honda Motorcycle Company is the first company to offer the option of an airbag, which is available on one of the most expensive models. The option became available in 2006. A handful of companies have recently developed wearable airbags, which are worn either inside a jacket or strapped on outside. No data on the effectiveness of these new items has been published.
Motorcycle Helmets: In 2008 motorcycle helmets saved 1,829 lives. NHTSA says that if all motorcyclists had worn helmets, 823 more lives would have been saved. Helmets are estimated to be 37 percent effective in preventing fatal injuries for motorcycle riders (operators) and 41 percent effective for motorcycle passengers.
Motorcycle Helmet Use Laws: According to the Insurance Institute for Highway Safety, 20 states and the District of Columbia had laws on the books requiring all motorcyclists to wear helmets as of January 2010 (See chart below). In another 27 states only people under a specific age (mostly between 17 and 20 years of age) were required to wear helmets. Three states (Illinois, Iowa and New Hampshire) had no helmet use laws. A NHTSA study covering 10 states found that when universal helmet laws, which pertain to all riders, were repealed, helmet use rates dropped from 99 percent to 50 percent. In states where the universal law was reinstated, helmet use rates rose to above 95 percent.
According to NHTSA’s National Occupant Protection Use Survey, a nationally representative observational survey, motorcycle helmet use rose to 67 percent in June 2009 from 63 percent in June 2008. Helmet use reached a high of 71 percent in October 2000. Use rates remain lower in states that do not require all riders to use helmets. In June 2009, 86 percent of motorcyclists in states requiring helmet use wore them, compared with 55 percent of motorcyclists in states that do not. Motorcycle helmet use was highest in the West, at 83 percent, and was 67 percent in the Midwest, 65 percent in the South and 61 percent in the Northeast, up from 45 percent a year ago. The survey counts only helmets that comply with Department of Transportation standards.
| Universal law | Partial law (1) | |
|---|---|---|
| State | ||
| Alabama | X | |
| Alaska | 17 and younger (2) | |
| Arizona | 17 and younger | |
| Arkansas | 20 and younger | |
| California | X | |
| Colorado | 17 and younger and their passengers 17 and younger | |
| Connecticut | 17 and younger | |
| Delaware | 18 and younger | |
| District of Columbia | X | |
| Florida | 20 and younger (3) | |
| Georgia | X | |
| Hawaii | 17 and younger | |
| Idaho | 17 and younger | |
| Illinois | ||
| Indiana | 17 and younger | |
| Iowa | ||
| Kansas | 17 and younger | |
| Kentucky | 20 and younger (3), (4) | |
| Louisiana | X | |
| Maine | 17 and younger (4) | |
| Maryland | X | |
| Massachusetts | X | |
| Michigan | X | |
| Minnesota | 17 and younger (4) | |
| Mississippi | X | |
| Missouri | X | |
| Montana | 17 and younger | |
| Nebraska | X | |
| Nevada | X | |
| New Hampshire | ||
| New Jersey | X | |
| New Mexico | 17 and younger | |
| New York | X | |
| North Carolina | X | |
| North Dakota | 17 and younger (5) | |
| Ohio | 17 and younger (6) | |
| Oklahoma | 17 and younger | |
| Oregon | X | |
| Pennsylvania | 20 and younger (7) | |
| Rhode Island | 20 and younger (7) | |
| South Carolina | 20 and younger | |
| South Dakota | 17 and younger | |
| Tennessee | X | |
| Texas | 20 and younger (3) | |
| Utah | 17 and younger | |
| Vermont | X | |
| Virginia | X | |
| Washington | X | |
| West Virginia | X | |
| Wisconsin | 17 and younger (4) | |
| Wyoming | 17 and younger |
(1) Universal laws cover all riders; partial laws cover young riders or some adult riders.
(2) Alaska’s motorcycle helmet use law covers passengers of all ages, operators younger than 18, and operators with instructional permits.
(3) In Florida and Kentucky, the law requires that all riders younger than 21 years wear helmets, without exception. Those 21 years and older may ride without helmets only if they can show proof that they are covered by a medical insurance policy. Texas exempts riders 21 years or older if they either 1) can show proof of successfully completing a motorcycle operator training and safety course or 2) can show proof of having a medical insurance policy.
(4) Motorcycle helmet laws in Kentucky, Maine, Minnesota, and Wisconsin also cover operators with instructional/learner’s permits. Maine’s motorcycle helmet use law also covers passengers 17 years and younger and passengers if their operators are required to wear a helmet.
(5) North Dakota’s motorcycle helmet use law covers all passengers traveling with operators who are covered by the law.
(6) Ohio’s motorcycle helmet use law covers all operators during the first year of licensure and all passengers of operators who are covered by the law.
(7) Rhode Island’s motorcycle helmet use law covers all operators during the first year of licensure and all passengers. Pennsylvania’s motorcycle helmet use law covers all operators during the first two years of licensure unless the operator has completed the safety course approved by the Department of Transportation or the Motorcycle Safety Foundation.
Source: Insurance Institute for Highway Safety, Highway Loss Data Institute.
| Year | Percent | Year | Percent |
|---|---|---|---|
| 1994 | 63% | 2005 | 48% |
| 1996 | 64 | 2006 | 51 |
| 1998 | 67 | 2007 | 58 |
| 2000 | 71 | 2008 | 63 |
| 2002 | 58 | 2009 | 67 |
| 2004 | 58 |
(1) Based on surveys of motorcyclists using helmets meeting Department of Transportation standards. Surveys conducted in October for 1994-2000 and in June thereafter.
Source: U.S. Department of Transportation, National Occupant Protection Use Survey, National Highway Traffic Safety Administration’s National Center for Statistics and Analysis.
| Year | Fatalities | Registered motorcycles | Fatality rate per 100,000 registered vehicles | Vehicle miles traveled (millions) | Fatality rate per 100 million vehicle miles traveled |
|---|---|---|---|---|---|
| 1998 | 2,294 | 3,879,450 | 59.13 | 10,283 | 22.31 |
| 1999 | 2,483 | 4,152,433 | 59.80 | 10,584 | 23.46 |
| 2000 | 2,897 | 4,346,068 | 66.66 | 10,469 | 27.67 |
| 2001 | 3,197 | 4,903,056 | 65.20 | 9,639 | 33.17 |
| 2002 | 3,270 | 5,004,156 | 65.35 | 9,552 | 34.23 |
| 2003 | 3,714 | 5,370,035 | 69.16 | 9,577 | 38.78 |
| 2004 | 4,028 | 5,767,934 | 69.83 | 10,122 | 39.79 |
| 2005 | 4,576 | 6,227,146 | 73.48 | 10,454 | 43.77 |
| 2006 | 4,837 | 6,678,958 | 72.42 | 12,049 | 40.14 |
| 2007 | 5,174 | 7,138,476 | 72.48 | 13,612 | 38.01 |
| 2008 | 5,290 | NA | NA | NA | NA |
NA=Data not available.
Source: U.S. Department of Transportation, National Highway Traffic Safety Administration; Federal Highway Administration.
| Year | Injuries | Registered motorcycles | Injury rate per 100,000 registered motorcycles | Vehicle miles traveled (millions) | Injury rate per 100 million vehicle miles traveled |
|---|---|---|---|---|---|
| 1998 | 49,000 | 3,879,450 | 1,262 | 10,283 | 476 |
| 1999 | 50,000 | 4,152,433 | 1,204 | 10,584 | 472 |
| 2000 | 58,000 | 4,346,068 | 1,328 | 10,469 | 551 |
| 2001 | 60,000 | 4,903,056 | 1,229 | 9,639 | 625 |
| 2002 | 65,000 | 5,004,156 | 1,293 | 9,552 | 677 |
| 2003 | 67,000 | 5,370,035 | 1,250 | 9,577 | 701 |
| 2004 | 76,000 | 5,767,934 | 1,324 | 10,122 | 755 |
| 2005 | 87,000 | 6,227,146 | 1,402 | 10,454 | 835 |
| 2006 | 88,000 | 6,678,958 | 1,312 | 12,049 | 727 |
| 2007 | 103,000 | 7,138,476 | 1,443 | 13,612 | 757 |
| 2008 | 96,000 | NA | NA | NA | NA |
NA=Data not available.
Source: U.S. Department of Transportation, National Highway Traffic Safety Administration; Federal Highway Administration.
| Fatality rate | Motorcycles | Passenger cars | Light trucks |
|---|---|---|---|
| 1997 | |||
| Per 100,000 registered vehicles | 55.30 | 17.81 | 15.23 |
| Per 100 million vehicle miles traveled | 20.99 | 1.45 | 1.24 |
| 2007 | |||
| Per 100,000 registered vehicles | 72.20 | 11.99 | 12.29 |
| Per 100 million vehicle miles traveled | 37.86 | 1.03 | 1.05 |
| Percent Change, 1997-2007 | |||
| Per 100,000 registered vehicles | 30.6% | -32.7% | -19.3% |
| Per 100 million vehicle miles traveled | 80.4 | -29.0 | -15.3 |
| Day of week | ||||||
|---|---|---|---|---|---|---|
| Weekday | Weekend | Total | ||||
| Time of day | Number | Percent | Number | Percent | Number | Percent |
| Motorcycle riders killed | ||||||
| Midnight to 3 am | 194 | 7.3% | 325 | 12.4% | 519 | 9.8% |
| 3 am to 6 am | 101 | 3.8 | 99 | 3.8 | 200 | 3.8 |
| 6 am to 9 am | 206 | 7.8 | 57 | 2.2 | 263 | 5.0 |
| 9 am to noon | 209 | 7.9 | 238 | 9.1 | 447 | 8.4 |
| Noon to 3 pm | 429 | 16.1 | 396 | 15.1 | 825 | 15.6 |
| 3 pm to 6 pm | 662 | 24.9 | 506 | 19.3 | 1,168 | 22.1 |
| 6 pm to 9 pm | 474 | 17.8 | 570 | 21.7 | 1,044 | 19.7 |
| 9 pm to midnight | 373 | 14.0 | 413 | 15.7 | 786 | 14.9 |
| Unknown | 9 | 0.3 | 21 | 0.8 | 38 | 0.7 |
| Total | 2,657 | 100.0% | 2,625 | 100.0% | 5,290 (1) | 100.0% |
| Motorcycle riders injured | ||||||
| Midnight to 3 am | 2,480 | 4.6% | 2,929 | 7.0% | 5,409 | 5.6% |
| 3 am to 6 am | 1,873 | 3.5 | 596 | 1.4 | 2,469 | 2.6 |
| 6 am to 9 am | 6,284 | 11.6 | 1,343 | 3.2 | 7,627 | 7.9 |
| 9 am to noon | 6,008 | 11.1 | 5,384 | 12.9 | 11,391 | 11.9 |
| Noon to 3 pm | 8,812 | 16.3 | 9,223 | 22.1 | 18,035 | 18.8 |
| 3 pm to 6 pm | 14,068 | 26 | 9,093 | 21.8 | 23,160 | 24.1 |
| 6 pm to 9 pm | 9,605 | 17.7 | 8,734 | 20.9 | 18,338 | 19.1 |
| 9 pm to midnight | 5,070 | 9.4 | 4,486 | 10.7 | 9,557 | 10.0 |
| Total | 54,199 | 100.0% | 41,788 | 100.0% | 95,986 | 100.0% |
(1) Includes 8 motorcycle riders killed on an unknown day of week.
Source: U.S. Department of Transportation, National Highway Safety Administration.
| Crash severity | ||||||||
|---|---|---|---|---|---|---|---|---|
| Fatal | Injury | Property damage only | Total | |||||
| Vehicle type | Number | Percent | Number | Percent | Number | Percent | Number | Percent |
| Passenger car | 20,376 | 40.4% | 1,624,000 | 56.1% | 3,931,000 | 54.9% | 5,575,000 | 55.1% |
| Light truck | 19,072 | 37.8 | 1,095,000 | 37.8 | 2,848,000 | 39.7 | 3,963,000 | 39.2 |
| Large truck | 4,066 | 8.1 | 66,000 | 2.3 | 309,000 | 4.3 | 380,000 | 3.8 |
| Motorcycle | 5,387 | 10.7 | 90,000 | 3.1 | 18,000 | 0.3 | 114,000 | 1.1 |
| Bus | 247 | 0.5 | 11,000 | 0.4 | 49,000 | 0.7 | 60,000 | 0.6 |
| Other | 625 | 1.2 | 8,000 | 0.3 | 10,000 | 0.1 | 19,000 | 0.2 |
| Total | 50,430 (1) | 100.0 | 2,894,000 | 100.0 | 7,166,000 | 100.0 | 1,011,000 | 100.0 |
(1) Includes 657 vehicles of unknown type involved in fatal crashes.
Source: U.S. Department of Transportation, National Highway Traffic Safety Administration.
PERSONS KILLED IN TOTAL AND ALCOHOL-IMPAIRED CRASHES BY PERSON TYPE, 2008
| Alcohol-impaired-driving fatalities (1) | |||
|---|---|---|---|
| Person type | Total killed | Number | Percent |
| Vehicle occupants | |||
| Driver | 19,220 | 7,181 | 37% |
| Passenger | 7,397 | 2,167 | 29 |
| Unknown occupant | 72 | 1 | 1 |
| Total | 26,689 | 9,349 | 35 |
| Motorcyclists | 5,290 | 1,733 | 33 |
| Nonoccupants | |||
| Pedestrian | 4,378 | 582 | 13 |
| Pedalcyclist | 716 | 80 | 11 |
| Other/unknown | 188 | 29 | 15 |
| Total | 5,282 | 692 | 13 |
| Total | 37,261 | 11,773 | 32% |
(1) Alcohol-impaired driving crashes are crashes that involve at least one driver or a motorcycle operator with a blood alcohol concentration (BAC) of 0.08 percent or above, the legal definition of drunk driving.
Source: U.S. Department of Transportation, National Highway Traffic Safety Administration.
DRIVERS IN FATAL CRASHES BY BLOOD ALCOHOL CONCENTRATION (BAC) AND VEHICLE TYPE, 1998-2008 (1)
| Passenger car | Light truck | Large truck | Motorcycles | |||||||||
|---|---|---|---|---|---|---|---|---|---|---|---|---|
| Percent | Percent | Percent | Percent | |||||||||
| Year | Total | BAC = 0.01+ | BAC = 0.08+ | Total | BAC = 0.01+ | BAC = 0.08+ | Total | BAC = 0.01+ | BAC = 0.08+ | Total | BAC = 0.01+ | BAC = 0.08+ |
| 1998 | 28,907 | 26% | 21% | 19,247 | 26% | 22% | 4,905 | 2% | 1% | 2,333 | 41% | 34% |
| 1999 | 27,878 | 25 | 21 | 19,865 | 26 | 22 | 4,868 | 3 | 1 | 2,528 | 40 | 33 |
| 2000 | 27,661 | 28 | 24 | 20,393 | 26 | 22 | 4,948 | 3 | 1 | 2,971 | 40 | 32 |
| 2001 | 27,444 | 27 | 23 | 20,704 | 27 | 23 | 4,779 | 2 | 1 | 3,261 | 37 | 29 |
| 2002 | 27,236 | 27 | 22 | 21,562 | 27 | 23 | 4,550 | 3 | 2 | 3,363 | 39 | 31 |
| 2003 | 26,422 | 26 | 22 | 22,172 | 25 | 22 | 4,658 | 2 | 1 | 3,800 | 36 | 29 |
| 2004 | 25,568 | 27 | 23 | 22,367 | 25 | 21 | 4,837 | 2 | 1 | 4,116 | 34 | 27 |
| 2005 | 25,046 | 28 | 24 | 22,879 | 25 | 22 | 4,900 | 3 | 1 | 4,679 | 34 | 27 |
| 2006 | 24,162 | 27 | 23 | 22,307 | 28 | 24 | 4,729 | 2 | 1 | 4,961 | 34 | 26 |
| 2007 | 22,765 | 27 | 23 | 21,719 | 27 | 23 | 4,601 | 2 | 1 | 5,306 | 35 | 27 |
| 2008 | 20,284 | 28 | 23 | 18,989 | 26 | 23 | 4,017 | 3 | 2 | 5,383 | 36 | 29 |
(1) NHTSA estimates alcohol involvement when alcohol test results are unknown.
Source: U.S. Department of Transportation, National Highway Safety Administration.
KEY SOURCES OF ADDITIONAL INFORMATION
 EINSURANCE